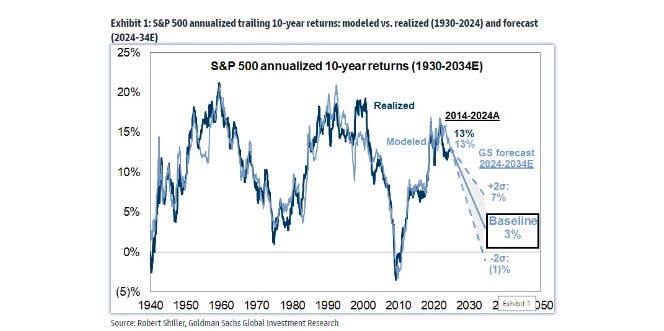
We estimate the S&P 500 will deliver an annualized nominal total return of 3% during the next 10 years (7th percentile since 1930) and roughly 1% on a real basis. Annualized nominal returns between -1% and +7% represents a range of likely outcomes around our baseline forecast and reflects the uncertainty inherent in forecasting the future. During the past decade the S&P 500 posted a 13% annualized total return (58th percentile).
We model prospective long-term equity returns as a function of five variables: (1) starting absolute valuation, (2) stock market concentration, (3) economic contraction frequency, (4) corporate profitability, and (5) interest rates.
Our baseline scenario assumes that US GDP contracts in four quarters (10% of the time) during the next 10 years. Our assumption is slightly greater than the past decade’s experience of 2 quarters (5% of time) and slightly less than the 5 quarter (13% of time) rolling 10-year historical average since 1950.
The distribution around our 10-year annualized total return forecast implies a 72% probability that the S&P 500 underperforms bonds, a 33% likelihood that equities generate a return less than inflation, and a 4% probability stocks post a negative absolute return (Exhibit 20).
Our 3% annualized 10-year return forecast for the S&P 500 is below the consensus average of 6%. … The distribution of consensus annualized ten-year return assumptions ranges from a low of 4.4% to a high of 7.4% with an average of 6%
So let’s think about this. They (deliberately) leave many of the details out of the paper.
They base the PE ratio off of CAPE (Shiller’s Cyclically-Adjusted-PE ratio) with a starting value of 38. They discuss (and assume) mean reversion to the long-term average of 22, but don’t state their assumption for the ending PE ratio.
They use a 4% rate for the 10 year UST.
They do not give us an earnings growth rate, but instead refer to a historical earnings growth rate of 7% (which seems slightly high) that thay derive from the last decade, and an assumption of 4 quarters of contraction during the 10 year interval.
If we assume:
~1.5% from dividends (current yield)
3% total return (their forecast)
3% return = 1.5% (dividend yield) + g (growth). This implies ~1.5% combined contribution from earnings growth and P/E change (3% - 1.5% = 1.5%).
Now, if GS is forecasting only 3% total return despite 7% earnings growth, this implies significant P/E multiple contraction. We can solve for the ending CAPE:
Over 10 years with log-linear reversion from 38x CAPE, this would imply a final CAPE of approximately: 38 * e^(-0.055 * 10) = 21.8x
Now, since CAPE is a 10 year historical PE, and more conventionally people like to talk about the one year forward PE, Goldman’s model predicts, with 7% annualized earnings growth, the the forward PE collapses from a current 22x (stated in their paper) to 12.6x at the end of year 10.
So, bottom line, all Goldman’s analysis model does is project a continuation of historical earnings growth and a full mean eversion of CAPE; a stagnant decade.
It does show that, absent even lower 10 year rates, the prospect for a lower 10 year ERP is real.
BTW: Vanguard currently estimates 10 year nominal US equity returns of 4.2%1
Empowered by recent advances in causal structure learning methods, this paper presents a study of the causal structure of financial risk factors and its evolution over time. In particular, the data we analyze covers 11 risk factors concerning the US equity market, spanning a period of 29 years at daily frequency.
Our results show a statistically significant sparsifying trend of the underlying causal structure. However, this trend breaks down during periods of financial stress, in which we can observe a densification of the causal network driven by a growth of the out-degree of the market factor node. Finally, we present a comparison with the analysis of factors cross-correlations, which further confirms the importance of causal analysis for gaining deeper insights in the dynamics of the factor system, particularly during economic downturns.
Our findings are especially significant from a risk-management perspective. They link the evolution of the causal structure of equity risk factors with market volatility and a worsening macroeconomic environment, and show that, in times of financial crisis, exposure to different factors boils down to exposure to the market risk factor.
How the anemic deal climate, record low distributions and massive unfunded capital commitments are pushing endowments further into illiquid private equity & venture capital, increasing risk & leverage in portfolios (and markets broadly).
Goldman Sachs GS 1.81%increase; green up pointing triangle this month sold $475 million of public asset-backed securitization, or ABS, bonds backed by loans the bank makes to fund managers that tide them over until cash from investors comes in.
The [capital call] transactions are relatively small for now. Still, they are intertwining banks (in Wall Street parlance, the sell side) with investors (the buy side) in ways that are new and difficult to parse for analysts, regulators and others.
Blackstone, the largest private-fund manager in the world, put about $25 million into Goldman’s capital-call deal in exchange for equity …
Some private-credit funds are developing another product that is similar to capital-call lines called net-asset-value, or NAV loans, made to private-equity fund managers. Rising interest rates have made it harder for private-equity funds to sell companies they own to repay their limited partners. NAV loans help them to start returning cash to clients until they can dispose of the companies. Many of the firms that manage private-equity funds also manage private-credit funds.
All kinds of conflicts and risks here. While small, the circularity of fund manager’s investing in these securities and having a loan in the securitization does not seem at all wise from a credit or financial stability standpoint. Can’t wait for the NAV-squared securitization deals.
Apollo Global Management Inc. is in talks to shift an investment in a single-family homebuilder from one of its private equity funds into a new vehicle to buy time.
Apollo is discussing moving the investment from a 2018 fund into a so-called continuation vehicle and has broached the idea with investors in recent weeks, according to people familiar with the matter. In these deals, managers shuffle assets from one fund to another. They enlist new investors to buy into the new fund and cash out old clients, often at a discount.
Private Credit
I’m going to reference these papers in my organized quotes below:
What began as a competitive dynamic between banks and private credit has evolved into an increasingly strategic partnership model. In the past year alone, fourteen banks have formed partnerships with private credit firms, compared to just two such deals in the prior year, marking a dramatic acceleration in this trend (van Steenis, 2024).
Huw van Steenis puts it pretty succinctly:
So look, if you take it since the financial crisis where we changed the regs for the banking system, a lot more capital, a lot less, shortened the asset liability duration … So these private credit firms have created just over a trillion dollar parallel system to lend to corporate America and parts of corporate Europe. And it's around leverage lending, it's areas which were either too risky or in some cases where the Fed put in limits on how many leveraged loans or what was the maximum, you know, multiple of leverage that a comparitive bank loan could take on. And so it was these loans were being pushed outside of the banks.
I think where we're going now is probably to the next level. … I think … it is that we are now retranching the banking system where the banks are laying off the junior risk to private credit. And that's allowing them to optimize their capital, but quite frankly, also lend more.
The top banks … are now saying ‘Actually, private credit allows me to recycle risk more quickly.
[As a] subplot, I mean, I think now of the top 10 firms, on my numbers, about 40% of the assets come from insurers. They become much more relevant to compete for the investment grade pieces on the banks.
Monetary Policy Transmission & Economic Effects
The rapid growth of private credit has fundamentally altered how monetary policy transmits through the financial system and impacts the real economy.
We find that non-bank lenders respond differently than banks to monetary contractions. While banks reduce lending in response to a monetary tightening, non-banks increase their credit supply and gain market share. … We provide evidence that non-banks' profitability remains high even during monetary contractions, unlike that of other banks, thereby rationalizing their inflow of long-term (debt) funding. Moreover, non-banks that fund a larger share of their operations with long-term financing drive the increase in the share of non-bank credit after a monetary contraction. We also show that increased non-bank lending reduces the monetary transmission to real outcomes.
While bank lending and nonbank lending move together—for example, following the 2008 Global Financial Crisis—most of the time, growth in bank and nonbank credit evolve separately. That is, for most years since 1950, bank lending to the private nonfinancial sector in the U.S. has moved asynchronously to nonbank lending"
They also highlight differences in economic outcomes between bank and non-bank credit expansion:
A one-standard-deviation-higher growth rate in bank credit increases the probability of real GDP growth below -2 percent in two years' time by 2.5 percentage points relative to a baseline 6 percent probability in our sample. In contrast, a one-standard-deviation-higher growth rate in nonbank credit lowers the probability of real GDP growth below -2 percent in two years' time by 1.9 percentage points.
The BIS research further identifies specific channels through which non-bank lending affects policy transmission:
The nonbank credit expansion is driven by long-term debt funding flowing to nonbanks. The attenuation of the traditional bank lending channel of monetary policy has real effects: nonbank credit insulates corporate investment and household consumption from adverse consequences of monetary contractions.
Financial Stability Concerns
The BIS notes:
Long-run trends in increased access to credit are thought to improve real activity. However, 'rapid' credit expansions do not always end well and have been shown in the academic literature to predict adverse real outcomes such as lower GDP growth and an increased likelihood of crises
Moodys notes:
There is synchronicity between bank lending and private credit fund capital raising.
Across 32 banks, average annual lending grew 18% between 2021 and 2023, in lock-step with the 19% increase in capital raising from private credit funds over the same period
There is significant concentration risk
The largest funds are the biggest customers of the banks, which is why we see the concentration
… on average, the surveyed banks lend to about 20 private credit clients.
As I’ve mentioned before, this retranching of risk between banks and non-banks can arguably lead to a more stable financial system.
Liberty Street writes:
… growth in bank credit predicts negative GDP growth in the medium to long term (three to ten years) [while non-bank credit expansions have less persistent negative effects].
And the BIS research supports this view, finding that
non-banks that fund a larger share of their operations with long-term financing are driving the increase in the nonbank credit share after a monetary contraction"
This contrasts with traditional banks' reliance on shorter-term funding, potentially making non-banks more resilient during stress periods.
van Steenis summarizes the risks thusly:
my take is that for a sector which is very low on leverage, doesn't have the big asset liability mismatches, is not systemically interconnected, and to be honest, it's still relatively small, less than $3 trillion. It's on the whole not a source of systemic risk.
But the question you gather [is] therefore ‘Well, are there pockets of leverage that we can't see?
In the charts below, I compare the growth of bank loans to nondepository financial institutions (NDFIs) such as private credit firms, hedge funds and securitization vehicles to all other bank lending, based on H.8 data from the Fed (weekly, not seasonally adjusted). What’s apparent is that the growth in bank lending to NDFIs has dwarfed that to the real economy.
So the Great Retranching of the Financial System, whereby NBFIs lend to leveraged borrowers (with 8%+ of interest in PIK form) and banks lend to the NBFIs is well underway.
I first wrote about single-asset deals blowing up in Perspective on Risk - July 29, 2024. Bloomberg has good reporting on this. As is often the case, vintage matters.
A Bloomberg analysis of almost every SASB (Single-Asset, Single-Borrower) tied to a US office property, more than 150 in all, revealed that creditors across numerous deals are on track to get only a portion of their original investment back. In multiple cases, the losses will likely reach all the way up to buyers of the AAA portions of the debt. This is in large part because unlike conventional CMBS, which bundle together hundreds of property loans, SASBs are typically backed by just one mortgage tied to one building.
To be clear, the SASB market — and the CMBS market overall — has begun to rebound some.
Similar to subprime, we have bad rating agency models, in part, to blame.
Over a quarter of outstanding SASB bonds originally rated AAA by S&P have had their credit rating cut, compared to just 0.4% for so-called conduit CMBS that pool large numbers of mortgages, according to data from Barclays Plc. For KBRA, 17% of outstanding AAA SASBs have been downgraded, versus just 0.3% of conduits.
Fortunately, the SASB market is notably smaller than the pre-crisis subprime market.
I previously wrote about how the ECB seemed lax in addressing their CRE issues.2 Time to take the US supervisors to the woodshed. Good work by the authors, Matteo Crosignani and Saketh Prazad.
This pisses me off. Supervisors should be enforcing discipline on the banks and cleaning up the balance sheets through charge-offs, capital raises and, where necessary, closures.
We show that banks “extended-and-pretended” their impaired CRE mortgages in the post-pandemic period to avoid writing off their capital, leading to credit misallocation and a buildup of financial fragility. We detect this behavior using loan-level supervisory data on maturity extensions, bank assessment of credit risk, and realized defaults for loans to property owners and REITs. Extend-and-pretend crowds out new credit provision, leading to a 4.8–5.3 percent drop in CRE mortgage origination since 2022:Q1 and fuels the amount of CRE mortgages maturing in the near term. As of 2023:Q4, this “maturity wall” represents 27 percent of bank capital.
Second, we use our supervisory loan-level data to … show that undercapitalized banks disproportionately extend the maturities of these distressed loans and understate their default probabilities, leading to fewer realized defaults. … We find that weakly capitalized banks assign a 0.9 percentage point lower probability of default to similar distressed loans compared to well-capitalized banks, a sizable effect given that the mean probability of default for distressed loans is 4.8%.
Third, we confirm that weakly capitalized banks engaged in extend-and-pretend by analyzing their indirect exposure to CRE through their lending to REITs that hold large portfolios of equity investments in CRE properties. We show that a loan to a CRE REIT that has experienced a large valuation decline is assigned a lower probability of default if granted by a weakly capitalized bank compared to a better capitalized one.
… we document that banks’ extend-and-pretend has led to an ever-expanding “maturity wall”, namely a rapidly increasing volume of CRE loans set to mature in the near term. As of 2023:Q4, CRE mortgages coming due within three years represent 27% of bank marked-to-market capital, up 11 percentage points from 2020:Q4—and CRE mortgages coming due within five years represent 40% of bank marked-to-market capital. We show (i) that weakly capitalized banks drive this expansion, consistent with their extend-and-pretend behavior, and (ii) that the maturity wall represents a sizable 16% of the aggregate CRE debt held by the banking sector as of 2023:Q4.
…Will CRE losses ricochet through the U.S. economy? Historically, real estate losses have amplified economic downturns, for example in New England in the 1990s. Declines in asset prices can be amplified beyond real estate when financial institutions such as banks cut back their loan supply in response to losses on bad loans and when foreclosures lead to fire sales of properties. Thus, regulators use capital requirements and supervision to ensure the safety and soundness of banks in the face of losses. This should ensure that banks have enough capital to withstand losses from CRE loans and continue to lend. Moreover, banks themselves have already responded to challenges by reducing the supply of CRE lending. The Fed looked at this in July and found that a significant net share of banks reported tightening lending standards for all types of CRE loans.
In summary, while the post-COVID economic environment has been throwing some tough punches at CRE, the knockout doesn't seem to be here. As the U.S. economy comes into better balance, risks from CRE are mitigated by strong economic growth. For now, CRE represents one more challenge for bank-dependent borrowers and CRE-lending banks.
So this sounds fine for an ex-ante commentary, but this line “Declines in asset prices can be amplified beyond real estate when financial institutions such as banks cut back their loan supply in response to losses on bad loans and when foreclosure lead to fire sales of properties.” has no place now.
We see from the above that some banks are extending-and-pretending. And the “continue to lend” is only because they have not taken the necessary losses.
I doubt Ms. Kovner, who I know from my NY Fed days, meant to come across sounding soft, but after reading the above piece it just struck me as wrong.
The story here pretends to be about Donald Trump. But the real story here is the risk of lending on buildings where there is a seperate ground lease. Good article.
This study systematically assesses expert beliefs about the probability of a nuclear catastrophe by 2045, … an event where nuclear weapons cause the death of at least 10 million people. Through a combination of expert interviews and surveys, 110 domain experts and 41 expert forecasters (“superforecasters”) predicted the likelihood of nuclear conflict, explained the mechanisms underlying their predictions, and forecasted the impact of specific tractable policies on the likelihood of nuclear catastrophe. Experts assigned a median 5% probability of a nuclear catastrophe by 2045, while superforecasters put the probability at 1%.
Conditional on a nuclear weapons catastrophe occurring by 2045, on average experts forecast a 45% probability that Russia and NATO would be the cause, roughly 20% both the Koran Peninsula and India and Pakistan, and roughly 13% for both Israel and Iran, and China and the USA.
More TD Bank
I missed this, though I probably knew it to be true. Supervisors hate “death penalties” as they would be a systemic disruption. I saw maneuvering to avoid it several times in my career.