
Perspective on Risk - Sept. 7, 2022 (Climate)
Expectations; Thinking in Physics; Non-linearity in Climate Change; Geopolitics; Climate & Farming; A sort relevant divergence
In the next few posts, I will tackle climate change, demographics, and geopolitical decoupling. I’m rewriting things as I incorporate the Poszar framework. If the post is too long for your email, please click over to the substack website.
I’m not going to go into the litany of evidence; I’ll leave it to you to Google if interested.1 Let’s instead talk about resetting our expectations of the future, and some of the effects we are seeing and may see in the future.
Expectations
The past will not be prologue. We have, as a species, shown little to no interest, at least until very very recently, in proactively tackling the problem.2


Bloomberg Green3 reported on a new report, The 6th National Climate Risk Assessment: Hazardous Heat, by First Street Foundation. You can download the paper at the link.


The results indicate that the incidence of extreme heat is growing across the country, both in absolute and relative terms. In absolute terms, the incidence of heat that exceeds the threshold of the National Weather Service’s (NWS) highest category for heat, called “Extreme Danger” (Heat Index above 125°F) is expected to impact about 8 million people this year, increasing to about 107 million people in 2053, an increase of 13 times over 30 years. This increase in “Extreme Danger Days” is concentrated in the middle of the country, in areas where there are no coastal influences to mitigate extreme temperatures.
To generate 2053 heat metric predictions, scaling factors are multiplied by the 2023 temperature predictions to create estimates of the projected increases at a 30-meter resolution.4
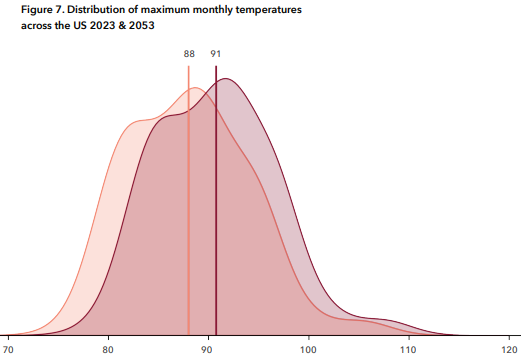
This results in an average F3 degree increase in average temperature. A small shift in temperatures can lead to a large increase in right-tail extreme events. This is the current expected path.
Under the high-emissions RCP8.5 scenario, much of northern Europe would be uninhabitable.5

Thinking in Physics
Here is a different, physics-based way of thinking about what is going on: Significant of a 1ºC increase in global temperature.
Since the Earth has been in radiative imbalance for at least 50 years, excess energy has been accumulating in the climate system. This energy goes into warming the oceans, the land, the atmosphere, and the cryosphere (ice).
The Intergovernmental Panel on Climate Change reports indicate that the global mean temperature is about one-degree Celsius higher than pre-industrial levels
We estimate the excess thermal energy trapped in the climate system (oceans, land, atmosphere) from a one-degree Celsius increase in global mean temperature, and show that it is thousands of times larger than the estimated energy required to form and maintain a hurricane. Our estimates show that global warming is forming a very large pool of excess energy that could in principle power heatwaves, heavy precipitation, droughts, and hurricanes.

One exajoule is roughly equivalent to California’s annual electricity use. A hurricane generally has between 10-100 exajoules of energy.
Non-linearity in Climate Change
The rate of change in global temperatures may be non-linear. One concern that has long been expressed is that methane will be released from the permafrost as artic warming occurs.
The FT has highlighted that there has been a surge in atmospheric methane, which is 80x as potent as atmospheric carbon.6

They note that the current surge is NOT from artic permafrost warming (yet) but rather:
Climate change is expected to lead to more intense rainfall in east Africa; and these wetter, warmer wetlands will produce more methane.
The impact of climate change is non-linear, in large part because we have built infrastructure assuming a stable distribution of outcomes.

Geopolitics
Historically, the US, Australia and Argentina/Brazil have been ‘long water’ and China has been short. China imports water in the form of foodstuffs that they cannot grow on their own.7

Let’s look at the WTO statistics for China’s agricultural imports8. The first thing we can see is that animal protein has drastically increased in the last ten years. In addition, three categories, oils, animal products & cereals, dominate imports.

In 2020, the top countries China imported foodstuffs from were Brazil, the US, Argentina and Australia. In 2010 Europe was a large source, but they no longer are as material. I’ve also shown Russia which, while relatively small, has grown materially.
The US is the primary source for cereals; Brazil for animal protein and oils.

Using a different source9, in 2019 China was already the largest importer of Russian animal products, and the 4th largest importer of vegetable product (behind Turkeie, Egypt and Iran). At this point, without significant further growth, it does not look like Russia could supplant S. America, US and Australia in meeting China's food (imported water) needs.
China has developed large stores of agricultural products to both smooth supply and to, to the degree possible, reduce their geopolitical risk.
Foreign Affairs has an article on China’s Growing Water Crisis10 . It takes a longer term view.
China is on the brink of a water catastrophe. A multiyear drought could push the country into an outright water crisis. Such an outcome would not only have a significant effect on China’s grain and electricity production; it could also induce global food and industrial materials shortages on a far greater scale than those wrought by the COVID-19 pandemic and the war in Ukraine. Given the country’s overriding importance to the global economy, potential water-driven disruptions beginning in China would rapidly reverberate through food, energy, and materials markets around the world and create economic and political turbulence for years to come.
The overpumping of aquifers under the Northern China Plain is a core driver of China’s looming water crisis.
China’s leadership is keenly aware that famines precipitated by drought helped topple at least five of China’s 17 dynasties.
Adam Toose also has an interesting writeup on the challenges facing China in Chartbook #145: China on the tightrope.
From China’s perspective, developing alternative sources of imported water, whether from Russia or Brazil/Argentina/Australia, and further building their stores of agricultural products, would seem a strategic imperative, particularly if they intend to attempt to retake Taiwan.
From a Chinese perspective, the S. America to Shanghai shipping route passes from the S. Atlantic through the Indian Ocean, probably the farthest away from key US naval bases11. US naval power is probably still sufficient to threaten the cutoff of food imports. They also need to rapidly diversify away from hydroelectric power, and appear to be moving towards alternative energy sources more quickly than the US.12
Climate & Farming
The drought in China is having a substantial impact on their agricultural production. This is being well documented by @Evan_Pay and @AndrewPolk81. If I summarize what I have read from them:
Six province-level areas are under drought warning (Sichuan, Chongqing, Hubei, Hunan, Jiangxi, and Anhui) and the major urban centers that rely on those regions for supply are Chengdu, Chongqing, Wuhan, Suzhou, Hangzhou, Shanghai.
Orchards and fresh vegetables are most affected; rice and livestock (pigs) to a lesser extent.
River-sea shipping along the Yangtze through Wuhan port, which is usually open through October, has already become unviable.

The Sichuan reservoir has released water to support agriculture; this affects its ability to act as a source of hydroelectric power. This power generally supports export industries.
According to Bloomberg, China is accelerating its corn imports from Brazil.

In the US, there are also burgeoning effects. Overall, US rivers are seeing reduced flow (though not nearly as bad as China or Europe; this may lead us to under-estimate the issue).

Of California’s approximately 100 million acres of land, 43 million acres are used for agriculture. Of this, 16 million acres are grazing land and 27 million acres are cropland. Only about 9 million acres of irrigated land (see illustration), or one-third of the state’s cropland, are considered to be prime, unique or of statewide importance. California has 9 million acres of irrigated farm land. Agriculture is the primary use of water.13
Paul Kedrosky notes that a record amount has been allowed to go fallow (and recorded as such for crop insurance purposes).

A sort relevant divergence
The Foreign Affairs article I cited above had another interesting paragraph (that led me down a bit of a rabbit hole).
According to data from NASA GRACE satellites, the North China Plain’s groundwater reserves are even more overdrawn than those of the Ogallala Aquifer under the Great Plains of the United States, one of the world’s most imperiled critical agricultural water sources.
So what is this Ogallala Aquifer and why is it important?
The Ogallala Aquifer (oh-guh-LAH-lah) is a shallow water table aquifer surrounded by sand, silt, clay, and gravel located beneath the Great Plains in the United States. One of the world's largest aquifers, it underlies an area of approximately 174,000 sq mi (450,000 km2) in portions of eight states (South Dakota, Nebraska, Wyoming, Colorado, Kansas, Oklahoma, New Mexico, and Texas).14
The aquifer decline is larger than Lake Mead, which filled to capacity is roughly 28.9 million acre-feet.15
[A]ccording to the Fourth National Climate Assessment (NCA4), producers are extracting water faster than it is being replenished.16
We project groundwater declines to assess when the study area might run out of water, and comprehensively forecast the impacts of reduced pumping on corn and cattle production. So far, 30% of the groundwater has been pumped and another 39% will be depleted over the next 50 y given existing trends. Recharge supplies 15% of current pumping and would take an average of 500–1,300 y to completely refill a depleted aquifer. Significant declines in the region’s pumping rates will occur over the next 15–20 y given current trends, yet irrigated agricultural production might increase through 2040 because of projected increases in water use efficiencies in corn production.17
Flooding
So of course its not just fire that we should worry about with climate change. As Pakistan18 has shown, flash flooding is another risk. If you are a risk manager, particularly in insurance, you need to consider flash flooding hitting your value concentration.
WeatherWest highlights a new research paper, Climate change is increasing the risk of a California megaflood19, revamps the 2011 ArkStorm model " aimed at more systematically characterizing the plausible range of megastorm and extreme flood events that might befall California both in the present era and in the future."
In ARkStorm 1.0, the underlying atmospheric scenario was composed of a synthetic concatenation of two severe historical regional California flood events in 1969 and 1986, plus an extra day of storm stalling for good measure.
[F]or ARkStorm 2.0, we did not limit our investigation to the historical record. Instead, we leveraged an existing climate model large ensemble (CESM-LENS) that includes 40 independent replications of both the 20th century and the projected future (21st century). That allowed use to explore a much larger “synthetic” sample size composed of hundreds of model-years for both the present and future era—giving us a better sense of the types of month-long storm sequences that are plausible on multi-centennial timescales.
Altogether, it appears that the plausible worst case scenario storms in a warming climate are likely to produce massive precipitation accumulations, but even more exceptional runoff in relative terms due to profound changes in mountain hydrology brought about by decreasing snow fraction
Here is a layman’s article, ARkStorm 2.0: Climate change is increasing the risk of a California megaflood, for those who prefer it to the paper.
Le Page, Heatwave in China is the most severe ever recorded in the world, New Scientist
Mooney, Stephens, The U.S. plan to avoid extreme climate change is running out of time, Washington Post

Kaufman, Much of the US Will Be an ‘Extreme Heat Belt’ by the 2050s, Bloomberg Green
The scaling was performed using an ensemble of 18 Global Climate Models (GCMs) from the Multivariate Adaptive Constructed Analogs (MACAv2) dataset (Abatzoglou & Brown, 2012) using climate scenario RCP 4.5.
Nazarian, Krayenhoff, Bechtel, Hondula, Paolini, Vanos, Cheung, Chow, de Dear, Jay,J. Lee, Martilli, Middel, Norford, Sadeghi, Schiavon, Santamouris, Earth’s Future, Advancing Earth and Space Science
World Integrated Trade Database, World Bank
Collins, Reddy, China’s Growing Water Crisis: A Chinese Drought Would Be a Global Catastrophe, Foreign Affairs

Ogallala Aquifer, Wikipedia
Brambila, Drying times: Could the rapidly depleting Ogallala Aquifer run dry?, Lubbok Avalance-Journal
Scott, National Climate Assessment: Great Plains’ Ogallala Aquifer drying out, Climate.gov
Stewart, Yang, Bruss, Apley, Tapping unsustainable groundwater stores for agricultural production in the High Plains Aquifer of Kansas, projections to 2110, PNAS