
Perspective on Risk - Dec. 6, 2023
QT, Reserves, Treasury Turmoil, Liquidity Risk, Unrealized Losses and Financial Dominance
Thank You
Kim Gambino has asked that I that those of you who donated to the Mission’s building fund. Here is the link if you’d still like to give. I stopped by and they’ve begun construction.
QT, Reserves, Treasury Turmoil, Liquidity Risk, Unrealized Losses and Financial Dominance
Big title. Maarten wanted “more big thoughts” so let’s see where this goes. I’m not sure this is profound; rather I hope to show you how numerous disparate things you read on the Perspective all relate. Let’s lay out how and why.
This may be painful: you have been warned.
From QE to QT - adding & draining reserves
Starting with the biggest picture, the Federal Reserve has been pumping stimulus going all the way back to 9-11 when Alan Greenspan was flown over the World Trade Center site on his way back from Basel. We had just come out of the dot-com bubble and he had been taking away the punchbowl before the attack. A few years later we had the Global Financial Crisis, which resulted in a material expansion of the Fed’s balance sheet, and then most recently Covid, which interrupted ‘normalization’ and led to further expansion of the balance sheet. The term ‘quantitative easing’ has become part of the lexicon.
The Fed increases the money supply (and changes the risk premia) by purchasing securities. In the various QE experiences, the eligible securities have expanded, but for the most part they are UST and govt-guaranteed mortgage-backed securities. When the Fed buys securities from a bank, it pays for these securities by crediting the bank’s reserve account. Reserves are what is called “inside money” - that is, money that only banks have access to for the purpose of settling transactions with the Fed.
Reserves are great for bank liquidity, but they earn a very low rate. Reserves are mostly used to facilitate inter-bank payments. Before the GFC, banks maintained relatively small reserve balances compared to their outgoing payment volumes. They relied on inbound flows to cover the majority of outgoing payments.
In 2019, the Fed adopted Statement Regarding Monetary Policy Implementation and Balance Sheet Normalization, which is colloquially known as the ‘ample reserve framework.’
The Committee intends to continue to implement monetary policy in a regime in which an ample supply of reserves ensures that control over the level of the federal funds rate and other short-term interest rates is exercised primarily through the setting of the Federal Reserve's administered rates, and in which active management of the supply of reserves is not required.
Going back to your college Money & Banking course, you will remember that the Fed can either control the quantity of reserves, or the price of these reserves, but not both. Here the Fed tells us they will focus on the price, not the quantity.1
This ‘ample reserve’ regime is also often called a ‘liability-driven floor system’ by economists because the central bank will set a floor yield for reserves that is slightly below the market clearing price.2
In theory, because floor systems remove incentives to economize on liquidity, they should reduce liquidity risk in the financial system. Yet, in economies around the world that use floor systems, we have seen serious liquidity strains in recent years.3
But because the ballooned Federal Reserve balance sheet due to asset purchases, we are in an ‘asset-driven floor’ regime. Some have called this an ‘abundant reserve’ framework. Lorie Logan spells this out in her recent speech Ample reserves and the Friedman Rule
When a central bank acquires assets for those reasons, it also issues more reserves, creating an asset-driven floor system. In such a system, … reserve supply in an asset-driven floor is a side effect of the central bank buying assets in response to severe macroeconomic or financial stress.
The Federal Reserve is currently in an asset-driven floor system as a result of our post-pandemic purchases. However, we are running off our asset holdings to return to a liability-driven floor. This is our second such normalization cycle, following the post-GFC normalization of our balance sheet in 2018 and 2019.
As she states, the Fed wants to move from an ‘abundant’ framework back to an ‘ample’ framework to avoid ‘[distorting] the price of liquidity for non-bank market participants, and because it complicates monetary policy.
So to shrink the Fed balance sheet, they sell assets and withdraw reserves from the banking system. This can reduce bank liquidity and force them to change the composition of the assets held for liquidity management and settlement purposes.
Again, reserves are used for transactions between banks, but the more important ball game these days is collateralized dealings between banks and non-bank counterparties like hedge funds. And the primary collateral used is US Treasury bills.
And so, because of this centrality to the collateral system, policymakers are pushing to move from bilateral settlement to central clearing in the UST market.4 Alphaville has a good discussion of why this matters in Treasury clearing 101.
Over the past 15 years, the size of the Treasury market has ballooned, and banks’ balance-sheet capacity has been limited by regulations. This left an opening for a cohort of prop-trading firms and hedge funds to step in and act as intermediaries instead. This is largely how the rules were meant to work; with rare exceptions, hedge funds and other end investors can take big losses in markets without also risking a collapse of the global financial system.
The catch is that these newer intermediaries still need financing and/or leverage, and that comes from banks. So in a global dash for liquidity and bank funding (like in March 2020), the cost of trading Treasuries skyrockets and things start to get really weird for everyone, whether they’re a bank or not.
Netting and cross-margining in a central system would significantly reduce payment flows and counterparty settlement risk. But this isn’t where we are today!
Even in this world of ‘abundant reserves’ we have seen several episodes of liquidity disruptions.
Trading demand has overwhelmed dealer intermediation capacity in recent episodes such as the September 2019 strains in the US Treasury repo market, the March 2020 global ‘dash for cash’ and the September-October 2022 stress in the UK gilt market . . . Moreover, with government bond markets growing faster than dealer balance sheets, there is a risk that such episodes could recur or even become more frequent in the future.5
So this above is exactly what we have discussed in numerous posts. Risk-taking is being pushed to the periphery, but the banks are still central as they determine the leverage the periphery can receive.
So What Is Normal Anyhow?
So now we are again in a phase of ‘normalization’ through a process of ‘quantitative tightening.’ The Fed is running off or selling down its securities portfolio. This should have the effect of draining reserves from the banking system. QT is continuing to withdraw reserves from the system, which will further pressure bank settlement liquidity management. [Aside: I am totally ignoring the additional complications of the Fed’s RRP facility in this whole discussion; QT could pull reserves from that facility. That’s a whole other discussion.]
So the Fed must determine what the normal size of their balance sheet is in the future; they must decide how large that needs to be and what is the proper aggregate level of reserves in the banking system to facilitate settlement.
The FT had a nice piece addressing Goldman’s analysis of the situation in The Fed’s balance sheet isn’t so boring after all. They quote the GS analysts as stating:
The FOMC will likely aim to stop balance sheet normalization when bank reserves go from “abundant” to “ample”—that is, when changes in the supply of reserves have a real but modest effect on short-term rates.
We expect the FOMC to begin considering changes to the speed of run-off around 2024Q3, to slow the pace in 2024Q4, and to finish run-off in 2025Q1.
Our model suggests that short-term rates will start becoming more sensitive to changes in reserves around 2024Q3, and we expect the FOMC to begin considering changes to the speed of run-off at that point and then to slow the pace of balance sheet reduction in 2024Q4 by cutting the monthly run-off caps in half from $60bn to $30bn for Treasury securities and $35bn to $17.5bn for MBS securities.
We expect run-off to finish in 2025Q1, when bank reserves are 12-13% of bank assets (vs. 14% currently), or roughly $2.9tn (vs. $3.3tn currently), and the Fed’s balance sheet is around 22% of GDP (vs. around 30% currently and 18% in 2019). As run-off progresses, we expect the spread of the fed funds rate to the IORB rate to rise by 5-10bp over the next year, from -7bp currently.
So according to Goldman, we are about 16 months and $400 bln. of withdrawn reserves away from a normalized Fed balance sheet.
QT Increases Bank Liquidity Risk
This all then brings me to a speech by Bank of England’s Andrew Hausar: ‘Less is more’ or ‘Less is a bore’? Re-calibrating the role of central bank reserves. He asks three important questions:
First, how to judge where central bank balance sheets should settle in the medium term as monetary policy makers return inflation – which remains far too high – to target, through a combination of higher interest rates and unwinding Quantitative Easing (QE) and other ‘unconventional’ policy interventions;
Second, on the micro-prudential side, how to ensure that banks’ liquidity insurance remains appropriate as technological change increases the risk of larger and faster deposit runs, of the kind seen this Spring in the US; and
Third, on the macro-prudential side, how to ensure the stability of the financial system as a whole in the face of the growing incidence of systemic liquidity shocks, not just in banks but increasingly in non-bank market finance too.
Looking at his second point, bank liquidity management, Mr, Hausar makes the point that reserves are not just held for settlement risk, but that, especially following the weaknesses of the GFC, reserves are held as part of the ‘precautionary balances’ from a liquidity risk management perspective, and that reserves are an important component of banks’ compliance with the Liquidity Coverage Ratio (LCR).
Banks’ precautionary demand is likely to be much bigger, however. A central lesson of the GFC was that banks voluntarily held too few liquid assets to manage potential stress events. In response, banks have since 2013 been required to hold sufficient liquidity buffers to cover 30 days of stressed outflows, calculated by applying a set of weights representing a particular scenario to each type of bank liability
As reserves are withdrawn:
… banks’ preferred holdings of non-reserves HQLA will depend, amongst other things, on asset availability, relative rates of risk and return, regulatory rules… and perceived ease of monetisation in a stress.
bank deposits – a key driver of transactions and precautionary demand – are likely to decline as monetary accommodation is withdrawn and QE unwinds.
higher longer term interest rates are driving a shift from sight to time deposits (which have lower outflow rates), as depositors seek higher returns and banks bid up for funding
So, summarizing, there are two effects: increased liquidity risk due to other HQLA not being perfect substitutes for reserves, and pressure on deposits to shrink.
How Will QT Affect Deposits?
Well, we can look at how QE affected deposits: maybe that will give us some insight? Fed economists tried to answer this question in a Fed Note: Understanding Bank Deposit Growth during the COVID-19 Pandemic.
We present evidence that four factors can largely explain the growth in bank deposits over the two year period 2019:Q4 to 2021:Q4: 1) the initial spike in commercial and industrial (C&I) credit line drawdowns at the onset of the pandemic; 2) asset purchases by the Federal Reserve; 3) large fiscal transfers to households more likely to hold savings in the form of deposits; and 4) a higher personal savings rate.
The asset purchases by the Federal Reserve led to the creation of reserves in the banking system, and, to the extent that the Federal Reserve purchased the assets from nonbank entities, they also led to the creation of deposits.
One question is to what extent deposit growth during the pandemic can be directly accounted for by reserves growth due to the Federal Reserve's asset purchases.
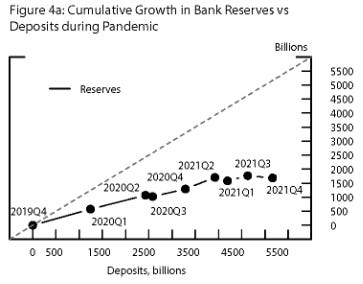
In Figure 5, we plot the cumulative change in domestic bank reserves vis-à-vis the cumulative change in domestic bank deposits during the three rounds of QE between 2008 and 2013. Two facts emerge from this figure:
First, in each round of QE, cumulative growth in both deposits and reserves were both much smaller than during the pandemic.
Second, deposit growth did not outpace the growth in reserves to the same extent that it has done during the pandemic; in fact, during the earlier rounds of QE1 and QE3 reserves growth exceeded deposits growth.
This pattern is consistent with the idea that at that time QE created deposits which then left the banking system more quickly than they have done during the more recent pandemic asset purchase program.

Let’s do some math. I will calculate deposits/reserves deltas6 during the 3 QE periods listed above, and from Covid: QE1 = 1.2x , QE2 = 0.5x, QE3 = 0.9x, Covid = 1.8x
Again, what this indicates is that deposits grew during Covid by a multiple of reserve changes, likely in part due to fiscal stimulus. This has ended (although the fiscal deficit remains large and is a continuing source of ‘juice’ to the economy relative to ‘normal.’)
Soooo… if GS says we have $400 bln of reserves to go. This could equate to $730 bln of deposits. Again, we have no idea what the Fed intends long term for the RRP (currently $768 bln.)
So Let’s Look at the RRP Program
There is room for Goldman’s entire $400 bln reserve subtraction to come entirely from the RRP program. We should expect to hear soon about the Fed’s intentions around this program fairly soon. Drawing money from this program means there will be a decrease in the size of Treasury-only MMF. This money can then go either into the banks, into institutional MMF, or into other venues like repo.

We should also expect to see exactly what we have been seeing: risk premia rising as duration risk moves from the Fed’s portfolio to the market.
I think it is highly likely that the Fed chooses to keep the RRP in place even after they reach whatever ‘normal’ is - it seems like a useful tool for them to keep the short Treasury rate range-bound.
Unrealized Losses
QT, the rapid rise of interest rates and the roll off of the securities portfolio, generated large MTM losses across both banks and non-banks. There is some $700 bln. in unrealized losses in the regulated banking sector. There is about $2.1T of equity in the banking system, so 1/3rd of that capital is impaired.7

The Fed, by shrinking its balance sheet, makes it exceedingly difficult for banks to ‘grow their way out of problems.’ As deposits decline, banks faced with unrealized losses will have more pressure to maintain or raise deposit levels than other banks.
The link between unrealized losses and demand for liquidity
So banks face liquidity pressures, and have, to varying degrees, unrealized losses on their securities portfolios. They, of course, would like to ‘earn their way out’ of their problems. Alphaville addressed this dynamic in Why are US banks hoarding liquidity?
QT is supposed to be a mechanical process. When the Fed bought bonds it created reserves, so shouldn’t it destroy reserves when it reduces its bond holdings? That hasn’t happened. Instead the liquidity is coming out of the Fed’s reverse repo facility, or RRP, where money-market funds stash money overnight.
The problem is that it’s expensive for banks to hoard cash today, as Bank of America rates strategist Mark Cabana argues. “Banks are bidding up for liquidity,”
OK, but which banks and why?
He attributes this in part to the more-than-half-trillion-dollar elephant in the room:
unrealised losses on bond portfolios. Bank of America itself has among the steepest losses on that front, with $131bn of paper losses on its held-to-maturity securities in the third quarter.
Banks are also being encouraged to rely less on their lender of next-to-last resort, the Federal Home Loan Banks.
So banks with unrealized losses will 1) avoid recognizing the losses through sales, 2) seek to maintain (or even grow) their balance sheets to make the problem relatively smaller. Uninsured depositors will demand higher rates to place their funds at banks with larger unrealized losses; the implicit too-big-too-fail subsidy may help some of them at the margin. These banks should see rising funding costs relative to the stronger banks, all else equal.
I hopped onto the FFIEC National Information Center and picked off the top 10 UGLs. Didn’t tax effect the numbers here.
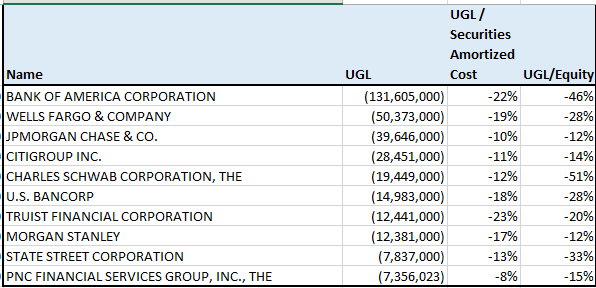
For context, Bank of America earned $8 bln last quarter; that’s quite a hole they’ve dug themselves. Charles Schwab earned $1.1 bln last quarter. Pretty strong argument for regulators to limit buybacks and dividends at these two. BAC of course has the 2nd largest non-interest bearing deposit base in the country.8
The FT has an article by Nick Dunbar that explains How zero-interest deposits bail out banks.
If you divide a bank’s interest income by assets, and interest expense by liabilities, you get a yield. At BofA, loans to consumers and companies earned a yield of 5.4 per cent in the first nine months of 2023, but this gets dragged down by the lower-yielding securities portfolio, giving a net yield on assets of 4.6 per cent. On the liability side, the yield is 3.4 per cent, so a slender 1.2 per cent difference.
Fortunately for BofA, if you include its $564bn of zero-cost deposits, the difference nearly doubles to 2.1 per cent. And it’s a similar story at other US banks.
Mr. Dunbar points out that the exact behavior we discussed above is occurring, Banks are losing non-interest bearing deposits to alternatives, and the banks with larger unrealized losses are losing deposits faster.
… these banks have lost a lot of non-interest deposits in the past year or so, as depositors steadily hunt for better returns for their deposits. Leading the pack is BofA with a 23 per cent year-on-year decline in non-interest rate deposits. Putting this into perspective, in the last quarter about $32bn of Bank of America’s zero-cost funding had to be replaced with more expensive liabilities.
He goes on to point out that the non-interest bearing deposits are quite similar to those that ran SVB.
Hence, Financial Dominance
So here is where we end up. We are in an environment of financial dominance, where the Fed has to manage interest rates with the constraint that further rises in the near term could tip over a systemically important bank. Fortunately, inflation and rates are trending in the right direction.
Furthermore, if banks really do feel a pressing need to hoard liquidity, that could mean that the other part of the Fed’s policy tightening — shrinking its balance sheet — will need to end sooner than economists expect.
Those who are older will remember that Paul Volcker famously broke inflation by deciding to focus on the quantity or reserves, and not the price.
An interesting primer here would be Lorie Logan’s Ample reserves and the Friedman Rule
Central clearing and the functioning of government bond markets (Bank Underground)
QE1: 1.2x (7763-7158)/(1073.6-581.6)
QE2: 0.5x (8144-7864)/(1594.5-1052.1)
QE3: 0.9x (10252-9103)/(2805.2-1547.4)
Covid: 1.8x (17776-13117)/(4165.5-1613.5)
Obscure footnote to close things out. The BHC with my favorite name, Big Poppy Holdings, which is in a hostile takeover battle with Summit State Bank, has the 2nd worst unrealized loss to total securities ratio in the industry. Fortunately, it’s not a ridiculous share of their equity.