
11/1/2021
Too fast; Too slow; The One Podcast to Listen to This Week
Too Fast
We are approaching a very rare time in the markets, when the short term interest rate will rise, perhaps materially. This would be only the 5th time since 1990 that this has occurred. 1994, 1999, 2004 and 2016. The pace of the rise in rates matters a lot. It affects the leverage certain investors employ, the income from holding positions for the roll, and the market value of longer-term assets.
1994/5 was a formative period for me. The rise in rates caught some market participants by surprise, and the rate of increase was faster than that implied by the forwards. In particular, this led to losses at quite a few investment bank’s clients, most notably those of Bankers Trust, such as Gibson Greetings, P&G and a host of others.
Here I’ve graphed the instantaneous 1 year forward rate against the 1 year bill rate shifted by 365 days. You can see that the gap between what the market expected and what actually occurred became as wide as 300 bp. Whether deliberate or not, subsequent rate rises appear to much more closely follow expectations. I suspect this was deliberate on the part of the Fed to avoid market disruptions.

The 2014 liftoff was notable in another way - the initial rise in rates was more gradual than in past periods. I suspect this was also deliberate. If rates rise more slowly than the forwards, roll remains positive and deleveraging can be more orderly.
In a past post, I suggested that the policy rate would remain low for quite a while, and that rates would not rise until QE ended. The risk of course is that this assumption is wrong, that the Fed feels the need to raise rates more rapidly to combat inflation. The longer the Fed waits to raise rates, the more steep the rate rise may need to be - so if they are to take the slower path of 2014, it is possible they may want to begin moving the policy rate sooner (but a at slow pace).
I do not that Goldman has moved up the date that they expect the first rate hike.

Sooner and slower may be a ‘risk management’ path that the Fed takes.
Too Slow
If the Fed in the past has raised rates too quickly, the collective action problem of climate change has certainly been too slow. While there has been a stated goal of limiting warming to 1.5° C, this will surely be missed. The recently published IPCC 6th assessment is confident that
“a best estimate of equilibrium climate sensitivity of 3° C” and that “global warming of 1.5°C and 2°C will be exceeded during the 21st century unless deep reductions in carbon dioxide (CO2) and other greenhouse gas emissions occur in the coming decades.”
CO2 emissions have increased by 50% since 2000, when we were all worrying about the computers.


Chatham House notes that if countries stick to, and achieve, their current commitments:
[T]here is a less than 5 per cent chance of keeping temperatures well below 2°C relative to pre-industrial levels, and less than 1 per cent chance of reaching the 1.5°C Paris Agreement target.
In Europe and North America emissions may have peaked, but in China, India, and the rest of SE Asia, Africa and S. America emissions are still rising.

Solar and wind may be booming, but they are an infinitesimal share relative to carbon-based fuels.

Pretty simple: as a first step China, India and the US need to stop building new coal plants and shut those now running. (graph from @pkedrosky). That also means Australia has to stop mining and selling the coal.

Many of us over the last several years have been engaged in understanding non-linear systems, and systems with reinforcing feedback loops. These characteristics reportedly apply to climate concerns. We should expect to see non-linear outcomes (surprises) in the years ahead.
B.2.2 With every additional increment of global warming, changes in extremes continue to become larger. For example, every additional 0.5°C of global warming causes clearly discernible increases in the intensity and frequency of hot extremes, including heatwaves (very likely), and heavy precipitation (high confidence), as well as agricultural and ecological droughts30 in some regions (high confidence). Discernible changes in intensity and frequency of meteorological droughts, with more regions showing increases than decreases, are seen in some regions for every additional 0.5°C of global warming (medium confidence). Increases in frequency and intensity of hydrological droughts become larger with increasing global warming in some regions (medium confidence). There will be an increasing occurrence of some extreme events unprecedented in the observational record with additional global warming, even at 1.5°C of global warming. Projected percentage changes in frequency are higher for rarer events (high confidence).
B.2.4 It is very likely that heavy precipitation events will intensify and become more frequent in most regions with additional global warming. At the global scale, extreme daily precipitation events are projected to intensify by about 7% for each 1°C of global warming (high confidence). The proportion of intense tropical cyclones (categories 4-5) and peak wind speeds of the most intense tropical cyclones are projected to increase at the global scale with increasing global warming (high confidence).
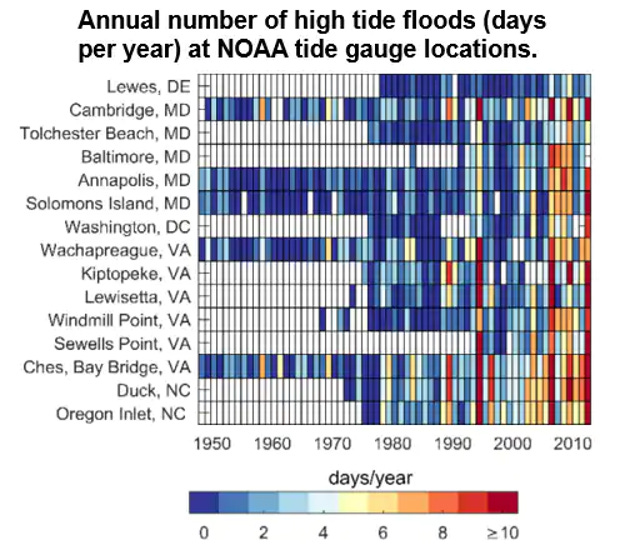
C.2.5 It is very likely to virtually certain40 that regional mean relative sea level rise will continue throughout the 21st century, except in a few regions with substantial geologic land uplift rates. Approximately two-thirds of the global coastline has a projected regional relative sea level rise within ±20% of the global mean increase (medium confidence). Due to relative sea level rise, extreme sea level events that occurred once per century in the recent past are projected to occur at least annually at more than half of all tide gauge locations by 2100 (high confidence). Relative sea level rise contributes to increases in the frequency and severity of coastal flooding in low-lying areas and to coastal erosion along most sandy coasts (high confidence).
C.3.2 Low-likelihood, high-impact outcomes34 could occur at global and regional scales even for global warming within the very likely range for a given GHG emissions scenario. The probability of low-likelihood, high impact outcomes increases with higher global warming levels (high confidence). Abrupt responses and tipping points of the climate system, such as strongly increased Antarctic ice sheet melt and forest dieback, cannot be ruled out (high confidence).
Again, this is current baseline, not tail outcomes.
From Chatham House:
By the 2040s, the probability of a 10 per cent yield loss, or greater, within the top four maize producing countries (the US, China, Brazil and Argentina) rises to between 40 and 70 per cent. These countries currently account for 87 per cent of the world’s maize exports. The probability of a synchronous, greater than 10 per cent crop failure across all four countries during the 2040s is just less than 50 per cent.
Food shortages are one of the largest factors driving global migration from poor to rich countries.
The problem, of course, is one of political economy. Prioritizing remediation efforts pits entities with different cost/outcome profiles. Australia and West Virginia, for example, benefit from the current status quo (coal) while coastal cities will bear more of the cost (sea rise, flooding, food costs, climate-change induced migration). There is also a time dimension to the political economy issue: a politician can readily pass the future outcome on to a future politician.
Since carbon emissions is an externality, and given the lack of political will to directly tax the externality in the US, policymakers now must resort to 2nd best solutions to attempt to have the cost of the externality internalized. This involves building public pressure on intermediaries to measure, report on, and limit their investments carbon exposure. Perhaps the most straight-forward approach has been to get firms to sign on to the Principles for Responsible Investment. All of this is designed to drive up the cost of capital of carbon emitting firms relative to ‘clean’ energy.
Interestingly, Olaf Stotz recently published “Expected and Realized Returns on Stocks with High‑ and Low‑ESG Exposure,” in the March 2021 issue of the Journal of Asset Management. Using a large sample of U.S. companies from 2008 to 2018, he formed a hedge portfolio that was long in high-ESG stocks and short in low-ESG stocks (an HL portfolio).
The HL portfolio earned a positive realized return of 2.3 percent per annum, and were not well explained by exposures to Fama-French factors. However, it earned a negative expected return of about -0.5 percent per annum.
The impact of discount rate news varied between 2.1 and 3.6 percent and explained to a large extent the unexpected return of the HL portfolio. The discount rate channel was explained by investor demand, not by time-varying risk attributes—an increasing share of investors with ESG preferences was positively correlated with a decreasing discount rate of the HL portfolio. An increase in the ratio of ESG investors to all investors by 10 percentage points increased prices of ESG companies with a high ESG rating by 9.5 percent relative to very low-ESG companies. H stocks are less risky than L stocks.
He concludes:
“The empirical results are compatible with the view that some investors have non-financial preferences linked to ESG. This view implies that expected future returns on the HL portfolio will be considerably lower than realized past returns if the demand for ESG stocks does not increase further.”
David Blitz, Swinkels and van Zanten, in a December 2020 paper, “Does Sustainable Investing Deprive Unsustainable Firms from Fresh Capital?”, examined whether fresh capital is flowing more toward sustainable than toward unsustainable firms. However, they conclude:
[O]ur empirical analysis of equity and bond issuance over the 2010-2019 period shows no evidence that fresh capital is flowing more towards sustainable than to unsustainable firms. More specifically, unsustainable firms appear to have had no problems in securing funding in public markets. This suggests that if the objective of sustainable investing is to deprive unsustainable firms from fresh capital, it was not effective over our sample period.
So I think the evidence of whether this approach will work remains in question; more direct approaches would likely be more successful.
The One Podcast to Listen to This Week:
Choiceology S8E6: The Power of Negative Thinking: With Guests Annie Duke, Mike Richard & Kelvin Wu Apple Podcasts, Google Podcasts, Spotify
Host Katy Milkman begins with the amazing story of a lake in Louisiana that completely disappeared in a matter of hours, and uses this example to discuss with Annie Duke (power all-star and decision theorist) that negative thinking—imagining failure in order to manage or prevent it— can actually help improve the odds of success when planning anything from a product launch to a birthday party. She argues that people shy away from negative thinking because it can feel unpleasant. But if you push through that unpleasantness, negative thinking can motivate you to take positive preemptive steps.
Related: Performing a Project Premortem (Gary Klein, HBR)

